Nsight Compute
Nsight Systems narrows a slow run down to a slow kernel; Nsight Compute is what explains why that one kernel is slow. It replays the kernel with hardware performance counters attached and organizes the results into sections that go from a two-number summary down to per-source-line detail, which is the tool The Optimization Workflow means by "measure first."
Kernel-level profiling
Where Nsight Systems sees one bar per kernel launch on a shared timeline, Nsight Compute sees the internals of a single launch: instruction mix, memory traffic at every cache level, occupancy, and stall reasons, all attributed to that one kernel in isolation. It isn't built to show concurrency or host/device overlap — that's Nsight Systems' job — it's built to answer, for a kernel already identified as worth investigating, exactly which resource it's bottlenecked on. That's also why it's the second tool, not the first: profiling every kernel in a large application at this level of detail is slow and produces more sections than anyone reads, so Nsight Systems narrowing the search to one or two kernels first is what makes this level of depth practical.
Capturing
ncu --set full -k saxpy -c 3 -o profile ./gpuapp     # full sections, 3 launches
ncu --set basic --target-processes all ./gpuapp      # cheap first pass
ncu -i profile.ncu-rep --page details                # re-read without rerunning
--set full collects every section this page and Metrics That Matter describe; -k saxpy filters to kernels matching that name, and -c 3 caps collection at the first three matching launches — without a cap, ncu profiles every single launch, which on a kernel called in a loop can take a very long time. --set basic collects a much smaller set of counters for a quick first look. -i profile.ncu-rep --page details reopens an already-captured report to read it again without rerunning the program.
Speed of Light
Speed of Light is the first section to read, and often the only one needed to classify a kernel: two percentages, compute throughput and memory throughput, each expressed relative to the hardware's peak. Reading those two numbers together is exactly the classification The Optimization Workflow builds its whole loop around — high memory throughput with low compute throughput is memory-bound, the reverse is compute-bound, both low is latency-bound. Everything below Speed of Light in the report exists to explain why one of those two numbers is where it is.
GPU Speed Of Light Throughput
    Compute (SM) Throughput      %          18.42
    Memory Throughput             %          86.71
    ...
The console excerpt above is illustrative, not a captured run — but the shape is the point: a large gap between the two percentages, with memory far ahead of compute, is what a memory-bound kernel's Speed of Light section looks like before opening any other section. The screenshot under The roofline chart below shows the real section in the GUI, where the same percentages appear as SOL SM, SOL Memory, and the per-level SOL L1/TEX, SOL L2 and SOL DRAM rows.
Memory Workload Analysis
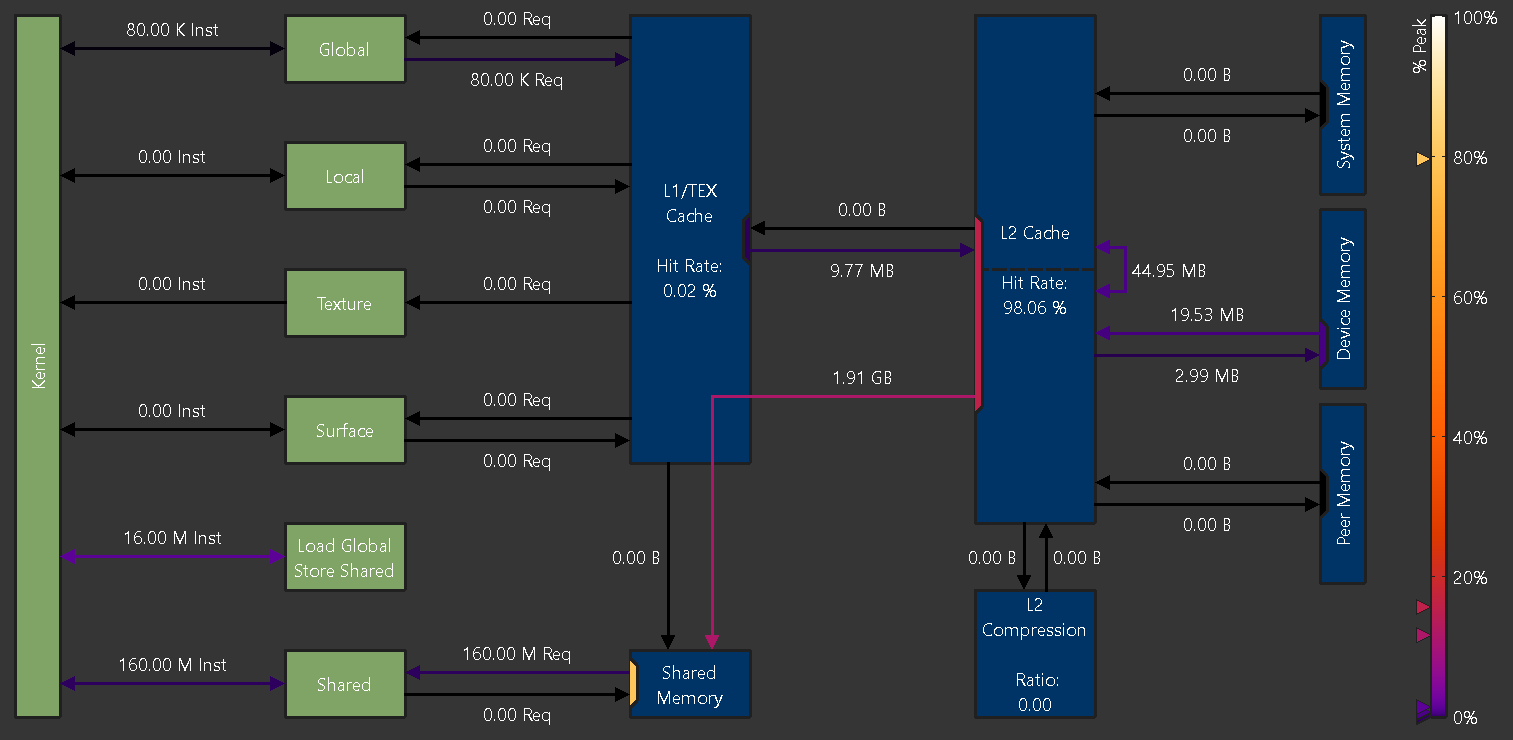 Source: NVIDIA Nsight Compute Profiling Guide
This section is a diagram of the memory path — registers, shared memory, L1, L2, DRAM — with the measured traffic Nsight Compute observed moving through each level for this kernel. In the chart above, the annotated hit rates make the story immediate: an L1 hit rate near zero alongside an L2 hit rate near 98% says the working set is missing L1 entirely but is still being caught before DRAM. The single most useful number in it is the ratio of requests to sectors per request: a warp's memory instruction issues one request, and if that request has to touch more DRAM/L2 sectors than the minimum the access pattern requires, the excess sectors are wasted bandwidth. That ratio is coalescing efficiency, and a poor one here is the concrete evidence behind a Speed of Light result that looks memory-bound without yet explaining why.
The roofline chart
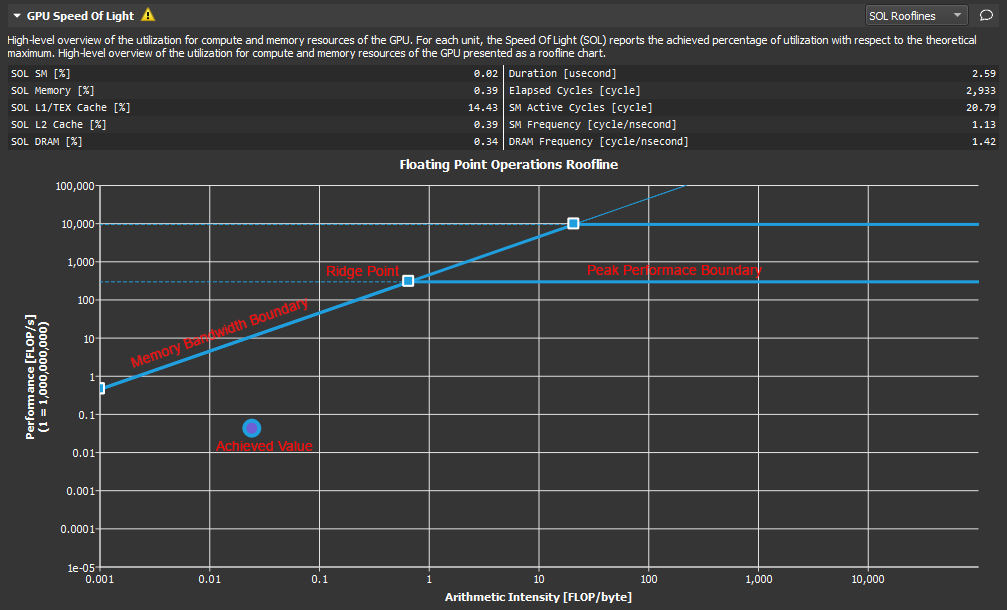 Source: NVIDIA Nsight Compute Profiling Guide
The roofline chart plots this kernel's achieved performance against the hardware's compute and bandwidth ceilings on a single log-log plot, arithmetic intensity on the x-axis and throughput on the y-axis. Where the kernel's point lands relative to the two roofline segments — the sloped bandwidth-bound line and the flat compute-bound line — shows at a glance which ceiling is actually limiting it and how much headroom is left before that ceiling. Roofline in Practice works through deriving and reading this chart by hand from raw counters; this page only covers where to find it in the report.
Source-level counters
The source-level view requires the kernel to have been compiled with -lineinfo (see Building CUDA with CMake); without it, ncu has no way to map counter samples back to a line in the original .cu file. With it, the source page shows stall reasons and memory traffic attributed per source line, which is the fastest way to go from "this kernel is memory-bound" to "this specific load is responsible" instead of guessing at which line in a long kernel body is the culprit.
Section sets and cost
ncu does not collect every counter by default because collecting them requires replaying the kernel once per group of counters that share hardware collection resources — a --set full run can execute the same kernel dozens of times to gather everything. --set basic trades completeness for speed as a first pass; --set full is for a kernel already narrowed down by Speed of Light to be worth the extra replays.
Profiling serializes and replays kernels, so a profiled run can be orders of magnitude slower than the same kernel running normally — the wall-clock time shown in an ncu report is a measurement artifact of the profiling process, not a benchmark. Never quote a profiled run's timing as the kernel's real performance; use --set basic for a first pass, and -k/-c to narrow collection to the kernels and launches that actually need --set full.
See also
- Metrics That Matter — the metric-by-metric reference for the counters named on this page.
- Roofline in Practice — deriving and reading the roofline chart by hand.
- The Optimization Workflow — the loop that Speed of Light's classification feeds into.
- GPU & Accelerators — the section index and its three learning paths.